Housing’s Strength
The housing boom has everything to do with supply and demand, and those fundamental features are not going to change anytime soon.
Doctors, dentists, lawyers, investors, neighbors, family, friends, it seems everybody has an opinion on the direction of housing. Unbelievably, only 19% of consumers believe that now is a good time to buy a home. That means that 81% think it is not a good time to buy. There are TikTok videos proclaiming the inevitable crash in housing. No longer than 3-minutes in length, the clips offer Chicken Little titles with no economic backing whatsoever. From YouTube to Facebook, social media has a big opinion when it comes to real estate. All of the noise, the “Gossip Factory,” feeds on everybody’s collective fears and prevents far too many consumers from making the sound decision to participate in this crazy housing market.
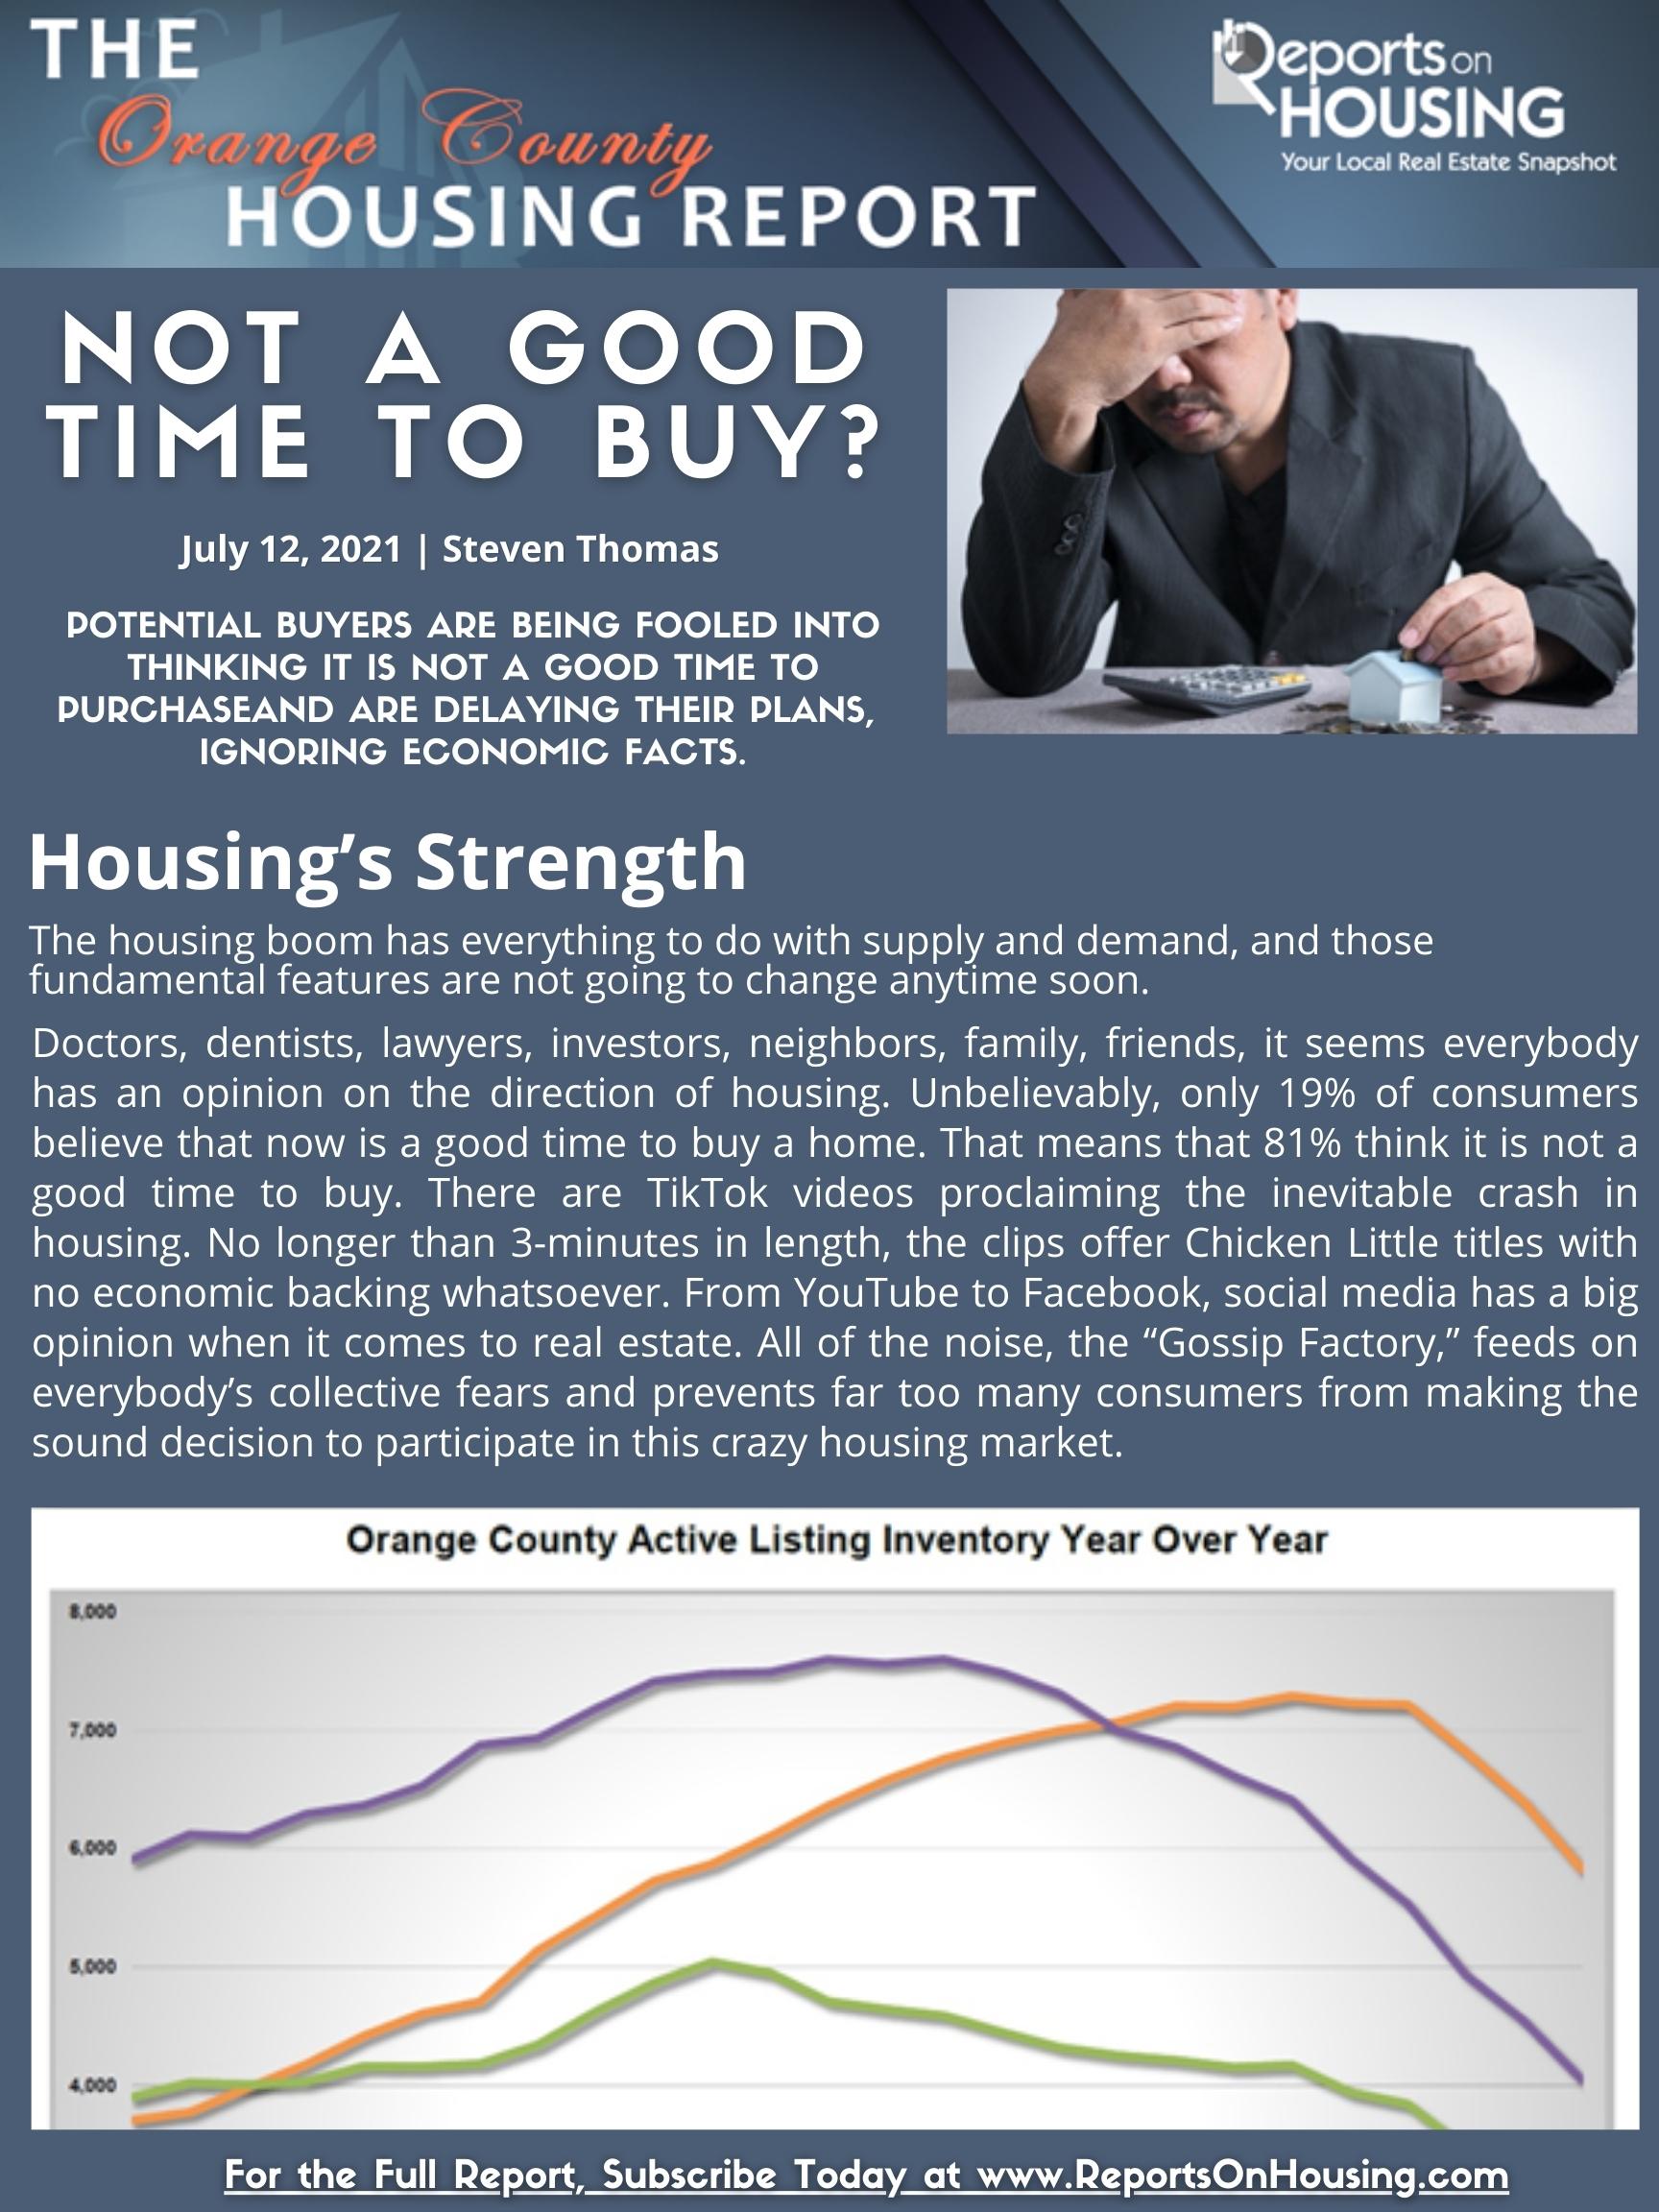
Today, it is completely different. There is no credit bubble like before. It is not easy credit that is the catalyst to the highest appreciation on record. Buyers cannot merely fog a mirror to obtain financing. Instead, they must qualify for loans, prove that they can afford the monthly payment. The process is intentionally cumbersome to prevent a repeat of 2007 to 2011. The current housing boom is quite simply due to supply and demand. Everyone is acutely aware of the current plight of the housing market: there just are not enough available homes to purchase. Supply is low. Recently the supply has been rising, up 14% in the past 4 weeks, but still at historical lows. At 2,528 homes, it is 46% less than last year’s level of 4,645, which was muted due to COVID-19. In comparing it to the 5-year average from 2015 to 2019 of 6,820 homes, it is 63% less. There are just not enough homes to satisfy the immense buying demand. That is the real issue, the supply side of the equation. For comparison purposes, in 2008 there were 18,000 available homes in Orange County. In 2006, a year before the start of the Great Recession, there were 16,000.
How about the demand side of the equation? It is elevated due to the historically low mortgage rate environment. After COVID-19 hit, mortgage rates achieved 17 record lows, starting with 3.29% in March 2020. It dropped to 2.65% during the first week of January this year. The record prior to last year was achieved in November 2012 at 3.31%. Last Thursday, July 8th, according to Freddie Mac’s Primary Mortgage Market Survey®, rates dropped to 2.9%. Prior to COVID, rates were hovering around 3.75%. Combine today’s low rates with a strongest demographic patch of First-Time home buyers in decades, and it is easy to see where all the demand is coming from. Even as values rise, homes are still affordable when factoring in rates and incomes.
It is important to also mention that there is not going to be a wave of foreclosures that will hit the market as soon as Forbearance comes to an end for a variety of sound economic reasons. Many doomsayers point to Forbearance and simply state that there will be a flood of foreclosures, and values will plunge like the Great Recession. The facts do not support this claim. There have been 7.2 million homeowners who have taken advantage of Forbearance. Of the 5.2 million homeowners who have exited Forbearance, 90% either are currently paying on time or paid off their loan. Of the 2 million homeowners with an active Forbearance, 90% have at least 10% equity, enough to sell their homes if they remain in a financial pickle.
ATTENTION BUYERS: now is a great time to buy due to historically low mortgage rates.
Housing is going to remain strong due to low inventory levels and strong demand fueled by low rates. It is simple Econ 101. This is not going to change anytime soon with no anticipated flood of homeowners coming to market to change the supply side of the equation. It will be more of the same. Follow an economic model and stop watching TikTok, YouTube, and Facebook videos that are not rooted in a laundry list of economic principles, charts, and irrefutable data.
Click on the image below the Read the Orange County Housing Report.